Howdy everyone! It’s a big day; the FED is speaking today. Let’s look at the price charts to see if the TA can tell us what’s going to come next.
In the second part of the video, I’ll talk about what’s going on in our new skool.
In the third part of the video, I’m going to share a chart that no one is looking at because it’s not Bitcoin. It’s not even a cryptocurrency, but you can grow your crypto by nailing it on this chart.
Let’s jump into the whale feeding Zone and Shark Feeding Zone. We do have some changes.
From yesterday, where the 4-hour has moved up a little bit, and it’s starting to look like it’s trending. We’re getting some direction out of that. If we go into the 12-hour time frame, we can see this is expanding up a little bit higher at the top and not much lower at the bottom. It’s like it’s expanding, widening to give room for prices to move up above there.
And I don’t know, of course, but when the daily is pinching down, and we’re all coming to a coalescence like this, I just want to zoom in.
Let me go to the 3-day, even more important to see the 3-day in its pinch like this. We’ve looked at that 3-day before and then compared where that lines up to a weekly. We can see the 3-day pinched super super tight back here, super super tight again. If we are in a similar pattern that we were in in the past, that we’ve come up, we’ve already done the pullback, so the big question is about to be answered as we are flaring past or down below the pinch that we’re seeing right now.
In other words, if we go to the present time here now, we can see where the Ballinger bands are pinched down really really tight. And a breakout above this is so crazy; everything is just going to go.
Now, it might not be everything. Bitcoin’s going to go, and the altcoins might get slaughtered because Bitcoin dominance will rise at the same time. So your risk control on each individual trade is still super important.
Now let’s continue zooming in here. We got the 12-hour, we got the 4-hour, we checked out the long term. Now we’re zooming into the 1 hour. It’s just been whale feeding and Shark Feeding inside these zones, just back and forth. Really difficult to trade if you’re doing it with any size.
And there we go, the FED leaves the rate unchanged,
sounds hawas note for March, which means that we’re going to be pumping like crazy from now.
I believe that the dollar Index is going to lose some ground, that gold and silver are going to be pumping up. So we could see the dollar Index; where we go DXY. So there’s a hammer reversal candle right there.
So I was kind of worried about the fact that we were outside the Ballinger bands. But now that we have this Hammer reversal candle there, it’s starting to look more bearish that we could continue down from here rather than reversing up hard.
So the dollar Index dropping down from here is going to make the Japanese Yen move, the Canadian dollar move; it’s going to make the metals move as well.
Before I get to that third part of the video, I want to talk about what’s going on over on our new skool.
https://introtocryptos.ca/skool
Yesterday we had the first free course launched;
today we have the springboard trade patterns course launched.
Those are both free courses that are available.
You can get the free course on the full five stages of the trade; you can learn that whole thing over on the skool now.
And this course is available as well, so you can learn the springboard pattern, and it’s super important for what’s going on with the altcoins.
Then tomorrow, the Ballinger band mean reversion course is going to be launched and be available.
The day after that, we’re going to have the popcorn Trading Co course available.
Then in the morning on Saturday, we’re going to have a state-of-the altcoin video call.
Tons of stuff going on in the community, but that’s not the important part.
The really important part is what’s going on with all the different people who are saying hello.
Benjamin, he’s been following our videos for a couple of years now; that’s great.
Temi, it’s great to see Temi is in here learning the one two three and learning to practice correctly and profitably.
Awesome to have you here.
Dalibor, welcome back; great to have you again.
Andrew from Australia, awesome mate; good to have you along.
Stezzy, hey, welcome, welcome aboard,
And everybody else who’s just joining, be sure to head out to the welcome aboard link here, expand this, and go and watch the new welcome intro video, check that out, check out this community, come and grab a new membership request pending.
And I’ve got a couple of questions for every new member who comes in; it’s awesome to get those answers and let me know what you’re actually looking for.
Super phenomenal; I’m really excited about this new community.
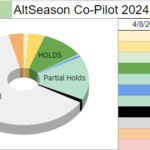
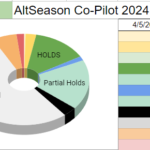
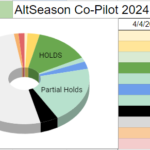
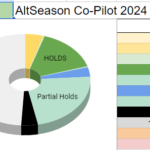
Now before I get into that third chart that I want to talk about, I just wanted to look at Bitcoin dominance here because if dominance is rising as all of this is going on, then we have to pay attention.
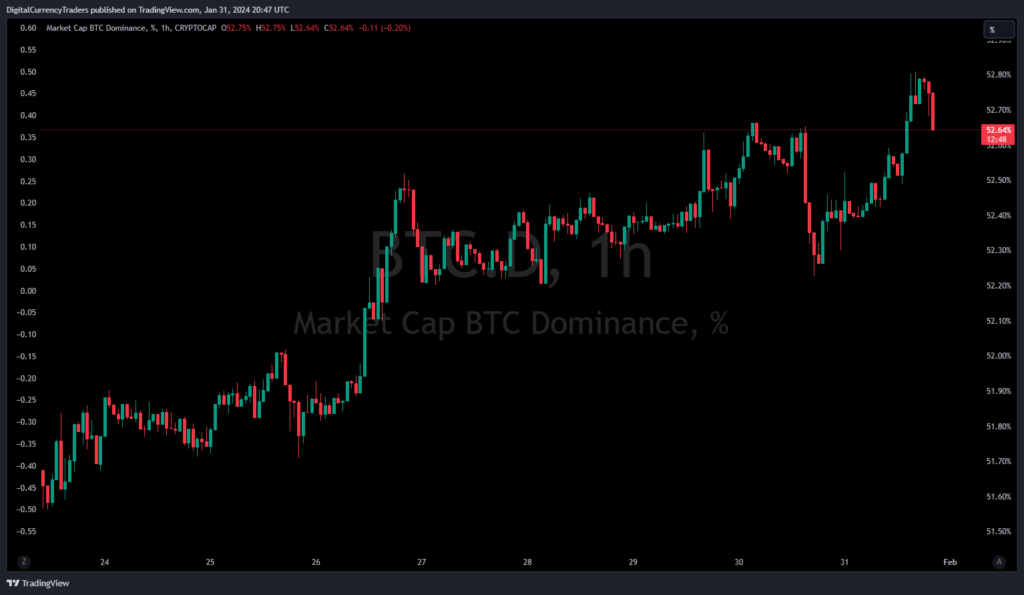
That this is telling us to get out of the alts back into Bitcoin if bitcoin’s taking off. And then we’ll watch this, and we’ll see how this is panning out. I’ll check each of the different trades.
Palladium
But now I want to go into that third section of the video and go into the TA and look at this chart. You can see here that Palladium, which you can trade over on simple FX, there’s a referral link down below.
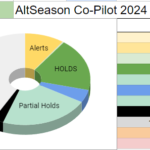
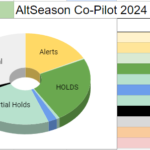
You can see that Palladium is now in alert status according to our alt season indicator.
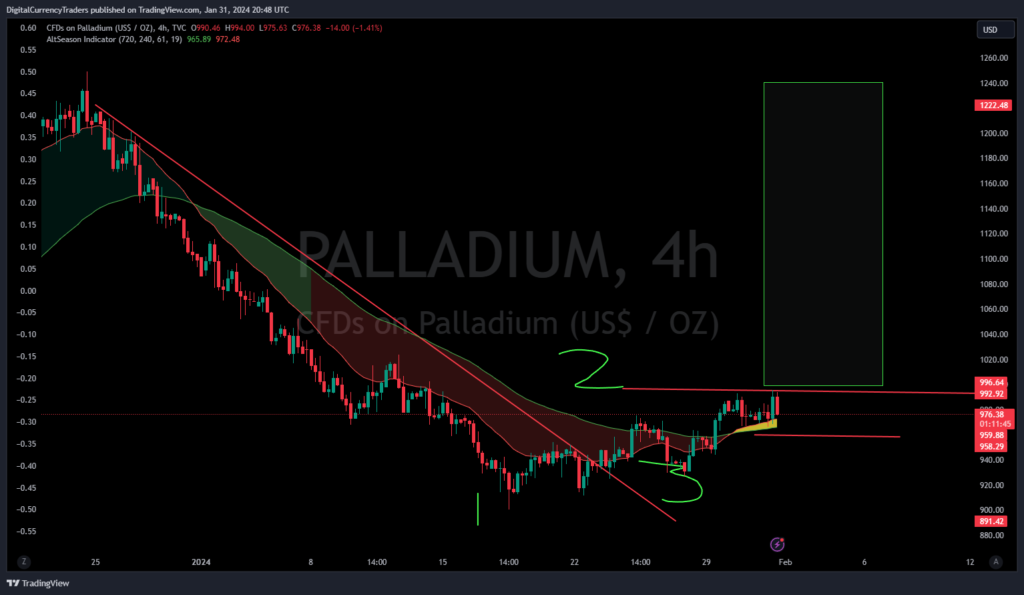
In other words, we’ve got the break of the downtrend line; we’ve got the 123 patterns setting up here, and we’ve ALS. And it’s just about to break the 123; our EMAs are just about to cross on the 60/20 time frame.
So that makes me want to zoom in on a closer time frame and to see is there a way that I could take a position on this that would be really low risk because it’s Consolidated so nicely.
There’s a pretty good risk profile on this trade if I could take a very small position in this, and then as soon as the price does move up a little bit, then maybe I want to check that out.
But you know there’s a lot more to be to know about Palladium.
So you know I did some research about how has the demand for Palladium changed over time and there’s a lot of details about the deficit coming up and the difference in the usage of Palladium.
So when you’re getting into trading any of these things, it’s much more than just trading the 123 formation.
Yet the 123 formation is exactly how we determine our entry, our exit, and our risk range so that we can know the risk profile before we put the trade on.
We’ve done stage one of the trade and planned it all out.
And now to finish up, let’s take a look at Bitcoin prices because we’re still in the middle of that conundrum where we have the one two three bottom prices are up above our stop.
We could do nothing right now; we should keep our hands off it. And we’re also below that one two three top formation that Bullinger band mean reversion and cell signal that we M mapped out there last week.
So we’re still right in the middle;
I’m super bullish. I’m not jumping back and forth in all of these; I’m just tracking them out just for the pattern.
https://introtocryptos.ca/skool
Super exciting times, and I’m really grateful to have you guys along.
I hope to see you over on the new skool; come and join us.
It’s a great community of people, trade safe, and keep those losses small.