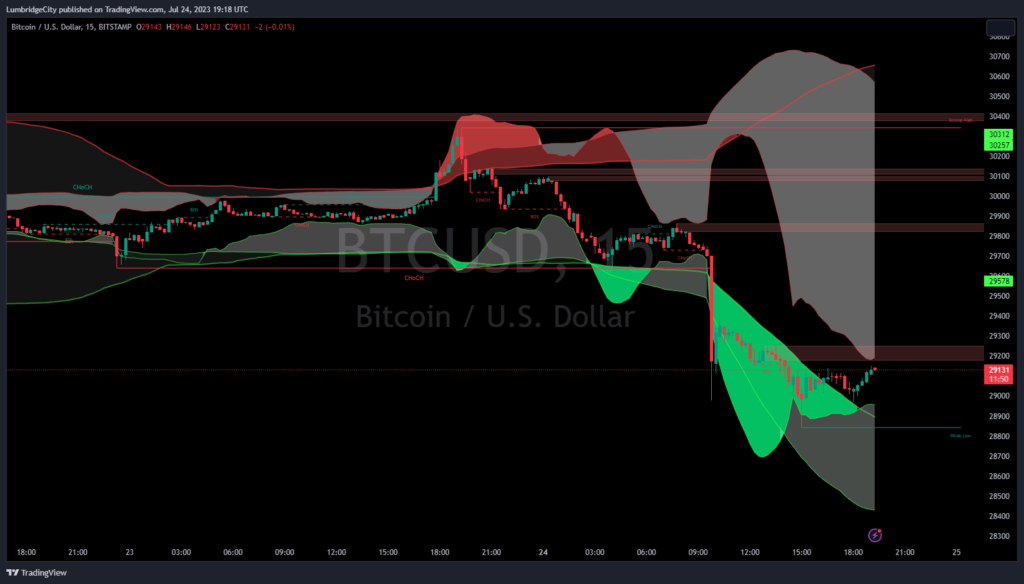
Bitcoin Dumps Below 30k – Bitcoin prices break lower passing key levels and into REVERSAL RANGES for the Bollinger Bands!
In today’s video I began with an analysis of Bitcoin’s price action across various time frames.
In examining the long-term chart on a weekly and monthly basis, I expressed concern over potential bearish movements due to a crossover of the 20-period moving average. If Bitcoin fails to recover at this level, it would signal a continued bear trend for our trading plan.
Trading Plan and Risk Management
Emphasizing the importance of a solid trading plan and risk management, I believe that every trader must prepare for all potential scenarios, be it bullish or bearish.
A trading plan should clarify when and where to enter and exit trades and how much capital to risk per trade. As a trader, it’s better to miss out on a trading opportunity than to enter a trade without a clear plan and risk management strategy.
Dealing with Market Volatility
I transitioned into a discussion on managing market volatility. The market can show significant swings, especially when there are fluctuations in the US dollar index. A potential rise in this index could lead to a crash in Bitcoin prices.
I stress the importance of being prepared to adapt trading strategies according to these swings. Notably, I point out the potential formation of a ‘one-two-three bottom formation’ in Bitcoin’s price as a crucial area to watch.
I also caution about the risks of adding onto trades too close to the initial entry point due to potential market noise.
Instead, it’s wise to wait for more space between the entry point and the stop loss to avoid being taken out of a good entry due to the ‘shark feeding and whale feeding’ zones in the market.
Analyzing the Bollinger Bands
Delving into more detailed technical analysis, I examined the Bollinger Bands. I noted that watching for a pinch in the bands and a subsequent widening can be a useful indicator for potential trends. However, I also warned that a pinch in the weekly bands might necessitate the release of short trades if the price begins to rise.
Custom Indicator for Bollinger Bands
I shared a custom indicator for the Bollinger Bands, explaining that when it turns bright green, it could signal a substantial reversal in the market.

However, I warn against impulsively adding onto a short trade when this signal is bright green. Instead, it’s crucial to observe these bright green signals, especially on longer time frames.
To finish, I invite other crypto creators to join our Discord community. This community focuses on fostering learning and sharing valuable content among its members.
Anyway, it’s great to have you along, and remember to trade safe and keep those losses small.
