Total change, fellas.
I’m teaching everything for free over on SKOOL, and I want to grow this community to 1000 PEOPLE in the next week.
That means the training and the content inside there HAS TO BE SOOO GOOD that you would be dumb not to sign up and get it today.
I’m launching the first of the free training courses.

I’m going to teach you how I find the one, two, three entries and the exits, and I’m going to make it practical for you by showing you all five stages of the trade.
I recently had an article published over on Inside Finance Wire.
Out of 2300 people, it says that once you learn this, you will never watch the charts all day again.
And I’ve got an article written on the Data-Driven Investor with 63,000 people that says that crypto trading is boring, and this is where to find the real financial excitement.
And that’s what I’m going to be teaching over on the 1,000 member crypto trading skool.
It’s more than just about crypto trading; all the training is going to be for free, it’s going to be easy, it’s going to be fun.
But we’re getting into more than just crypto trading; we’re talking about money making in all four different directions.
Our community is going to be real because we’re going to do it, and then we’re going to tell what happens.
Once You Learn This You Will Never Watch Charts All Day Again
Overcome The Chart Watching Trap
Trading Crypto is Boring
This Is Where To Find Real Financial Excitement
1000 Member Crypto Trading Skool
A Massive Growth Story For Every Content Creator
In this video I want to jump into the Whale Feeding Zone and Shark Feeding Zone and see what’s actually going on with Bitcoin prices in the 1-2-3s.
Because we’ve got some super important details coming out tomorrow where the FED may be announcing a change in the interest rates, and that’ll change what’s going on with the US dollar Index, and that could have a profound impact on everything else, super important, especially where we are right now.
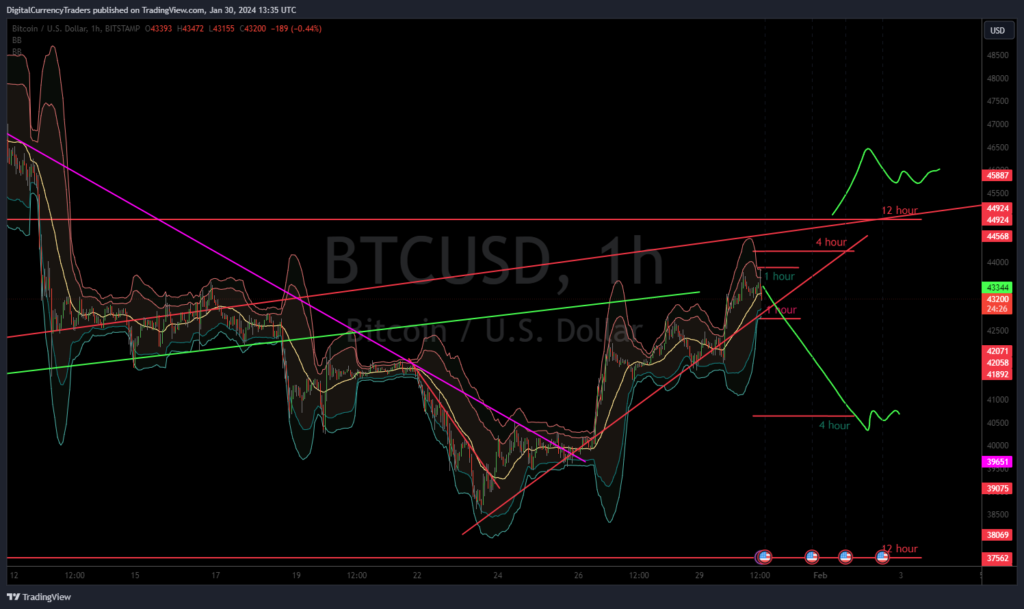
We’ll take a look at the next charts in here in a second. Let’s move the 12h hour bands over to see where we are.
I want to pay attention to where this band is so that I can look at where the 4H hour is compared to the 12h hour and track that.
The comparative position of these bands really helps to identify whether the 123 formation is valid or not.
So we’re getting lots of lines on this chart now, but now we have an uptrend, and I’m watching for the 123 formation. We see that the 1hour Binger band is pinned tight now at inside the 4H hour near the top of the 12h hour.
So when they all tighten up against the top of the bands like this and all the bands coalesce together, it does give it room to make a stab back more easily, it seems to me, than for it to punch up through.

On the other hand, if it does punch up through these and make support up above, this is super important that we really respect that.
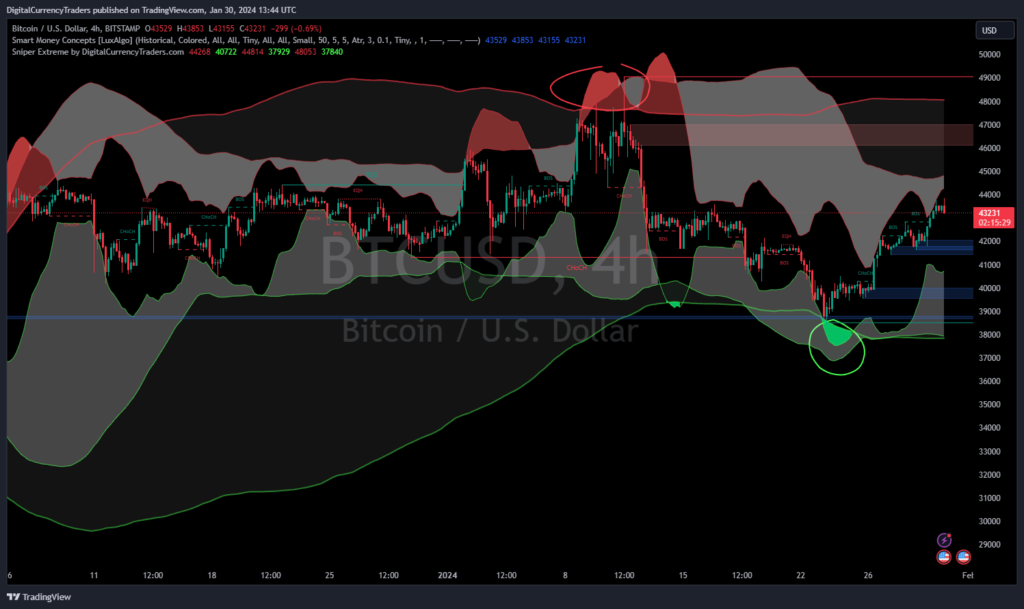
But this really still leaves us sort of in the middle because we had the Binger band mean reversion cell signal the other day, and I’m going to have a free course coming out that teaches exactly that. I have the video from when this happened as it was happening.
I was videoing the exact trading signal, and I’m going to have that available in the free course over in our new skool.
It’s going to be super cool to watch for those signals because as we have that sell signal, we could still have our stop loss just below our entry, and we’d still be in that position.
Yet we also have what was a Bollinger Band mean reversion Buy Signal down at the bottom here. We have the one 123s; we could have our stop-loss up above our entry.
In other words, we were right smack dab in the middle where we could be holding a short position in one account and be in profit, and we could be holding a long position in the other account and be in profit.
We’re right in the middle, so it’s a real uncertain time in this band where prices are going to go.
So anything that we are doing in Bitcoin would have to be super small in position size until we see what the US dollar Index is doing.
It is potentially a one, two, three top formation here, and I’ve seen these kind of candle formations before where I’ve nicknamed it the three touches of death where we have the one, two, three formation. But if we go up one, two, three times against that, we don’t have a uh, we don’t have a one, two anymore.
Now we have a one, two, three bottom.
This usually is the line where things change direction once we’ve hit it three times and we can’t penetrate, then it’s going to drop hard the other way.
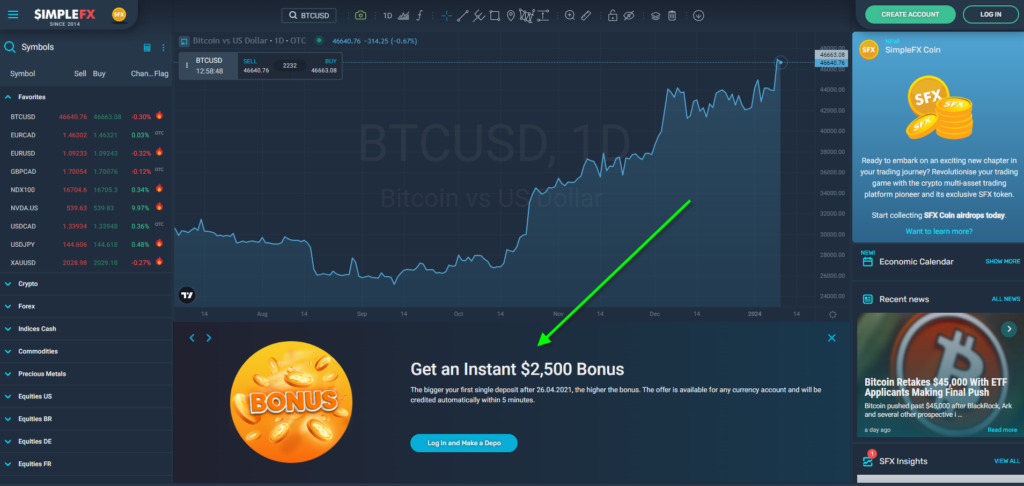
So the interest rate decision tomorrow is going to be super important because it’s also going to affect Japanese Yen and the Canadian dollar and being able to trade those patterns over on SimpleFX using your cryptocurrency is super exciting to me.

Oh, and by the way,
when I do that course on the Bollinger Band mean reversion signals,
I’m going to show how this indicator helps us identify it with the color coding.
Sniper Extreme Indicator

It really stands out with the one 123s, the relative strength index signals that we get.
It just nails these signals, and I’m going to put that all together in the free course, and you can come and join our skool because that free course launch is today this morning.
That course is already in there and complete.
You can go and access it.
And then tomorrow,
- I’ll be launching the springboard pattern course, and
- I’ll be putting in the Bollinger Band mean reversion course, and
- we’re going to do a course on the popcorn trading signals as well.
There’s a ton of stuff coming out in this, but I’m getting ahead of myself.
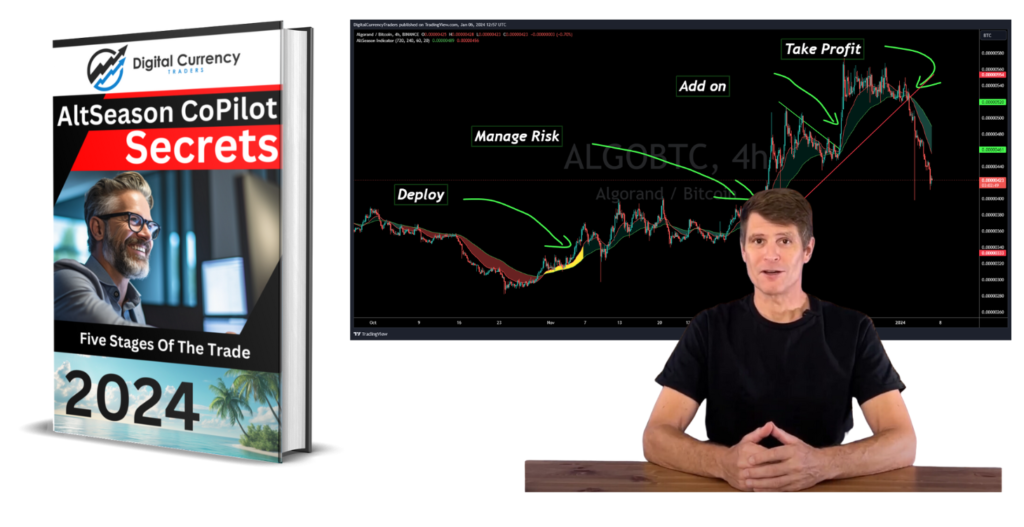
And now I want to finish the video with a little update on the altseason co-pilot.

I’m going to release a course on how to operate the altseason co-pilot and how our trading system works so that when we take the average of this trading system when we do it to all the different cryptocurrencies, it really tells us when to get prepared for cryptocurrency season and when to get out.

When we compare our data against the patterns in Bitcoin dominance, we can see that there is a direct correlation between those periods when our system is telling us that it’s time to get into altcoins.
We can see that the opportunities are setting up just before everything has gone into hold status, and there are waves and waves and waves of it as Bitcoin dominance is topping out.
And we’ve seen an important wave here that we can see that Bitcoin dominance was rising along here with Bitcoin, but recently it’s not been doing the same amount.
So the altcoins have been rising in value more than Bitcoin through this period from September and October through the through to now.
And we know that there’s been some coins like Sol and Link and um, Bake and a few that did some really huge moves, and that’s what’s causing the change in the all-in Bitcoin dominance this far.
And I do believe we’re topped out here in Bitcoin dominance that all those coins are going to be crossing the one 123 formations, and we’re going to be growing the number of Bitcoin that we hold by holding on to these altcoins.
Wow, we covered so much in today’s video.

If you want to catch up on this trading system now,
you can go and learn for free over on our skool.
I’d be super pumped to have you along there.
Help me make that 1,000 person goal in the next week, and I’m going to make the training so awesome that you’d be crazy not to come and join us.
Thanks again for watching, trade safe, and keep those losses small.
